Excel 365 + Vena = Magic
Vena is already a powerful tool for building dynamic, database-connected reports. Every template you create is tied directly to live data, giving users real-time access to the latest figures. That alone makes it flexible — but with the introduction of Excel 365’s dynamic arrays, reporting has entered a whole new era.
Let’s face it — if you’ve ever built a complex template, you know how difficult it can be to make structural changes later. A simple adjustment might seem harmless, but in a rigid, formula-heavy environment, even small tweaks can break the whole thing.
Before Excel 365, Excel-based reports were mostly static. You defined the rows and columns once — and any attempt to add or restructure later meant juggling formulas, ranges, and layout design. It often led to more pain than progress.
Enter Excel 365: The Game-Changer
With Excel 365’s spilled arrays, dynamic functions, and single-cell formulas, report design becomes completely flexible and future-proof. Now, you can build a report from scratch that adapts to structural changes automatically. Add rows? Done. Restructure columns? No problem. Everything flows from a single formula — one cell, endless adaptability.
We call it One-Cell Reporting.
The magic of this approach is that the visual layout of your report can fully respond to inputs or changes, without breaking or needing heavy rework. You can even allow end users to redefine report structure on the fly — and the calculations will follow.
The Recipe for One-Cell Reporting
To build a one-cell responsive template, you’ll need four core components:
- Data Source Tab. This is the engine of your report. Here, all relevant Vena mappings and raw data are pulled in — actuals, budgets, forecasts, transactions. You can also perform light data processing, like aggregations or basic calculations.
- Steering Tab. Think of this as your control panel. This tab allows you to define which rows and columns appear in the report, in what order, and under what logic. It’s where business rules and user inputs live.
- Report Tab (Visual Layer). This is what your users see — and where the real “wow” factor lives. With just one formula, the report dynamically populates based on the logic in your steering tab and the values in your data source. Add a GL account? Switch a period? The report updates instantly.
- Reference Tab. A helper space where lookup tables, mappings, and calculated references live. It keeps the rest of the workbook clean and modular.
Example: One-Cell Reporting in Action
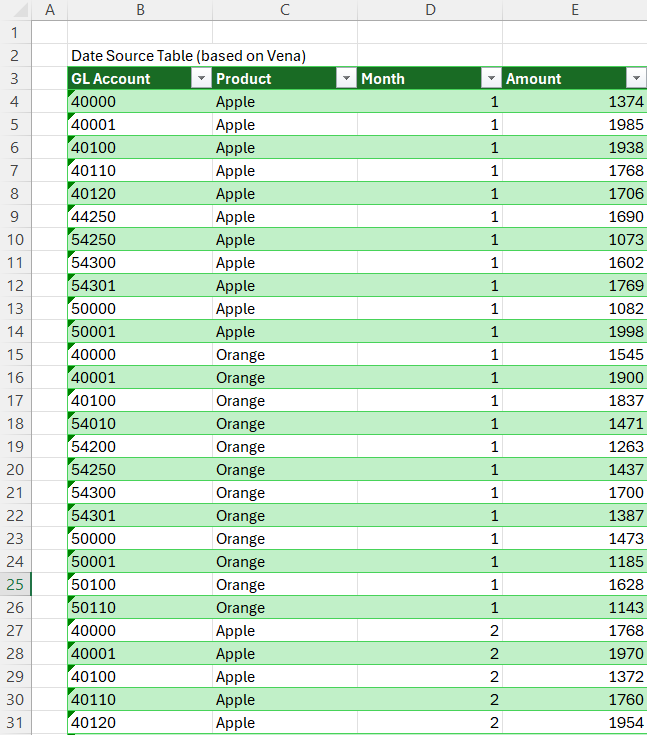
Let’s imagine we’re working with a live Vena connection, pulling data into a simple Data Source table. This table includes basic fields: GL Account, Product, Month, and Amount.
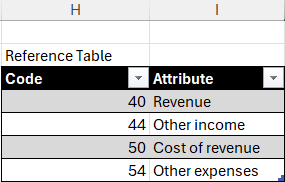
To enrich this data, we’ve added a small reference table that maps each GL Account to a specific attribute (e.g., Revenue, Cost of Revenue, Other Income).
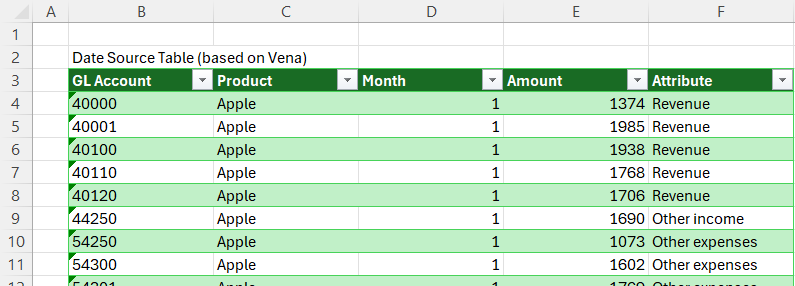
Using this reference, we extend the Data Source table to dynamically identify the attribute of each GL Account.
For added flexibility, we’ve also introduced two steering lists:
- One for selecting which products the user wants to see in the report
- Another for selecting which GL attributes (Revenue, Cost, etc.) to include
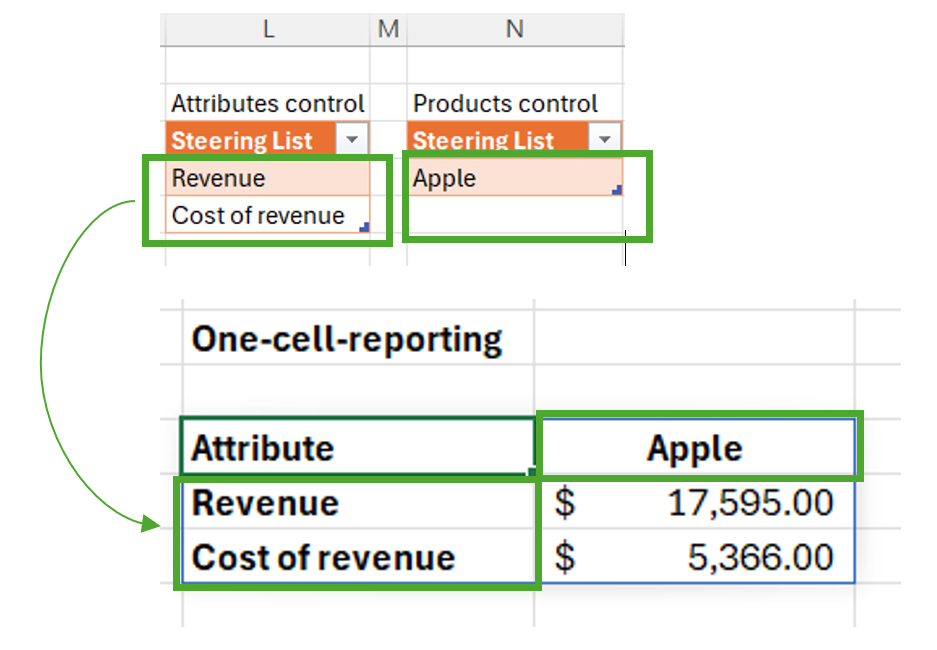
Now, here’s where Excel 365’s spilled array formulas make the magic happen.
With a single dynamic formula, we’ve aggregated the source data into a clean, interactive reporting view. The report layout responds in real time to changes made in the steering lists. You’ll notice the blue-bordered spill ranges that clearly define where the formula expands across the sheet — no manual range resizing needed.
What happens when the user wants to adjust the report?
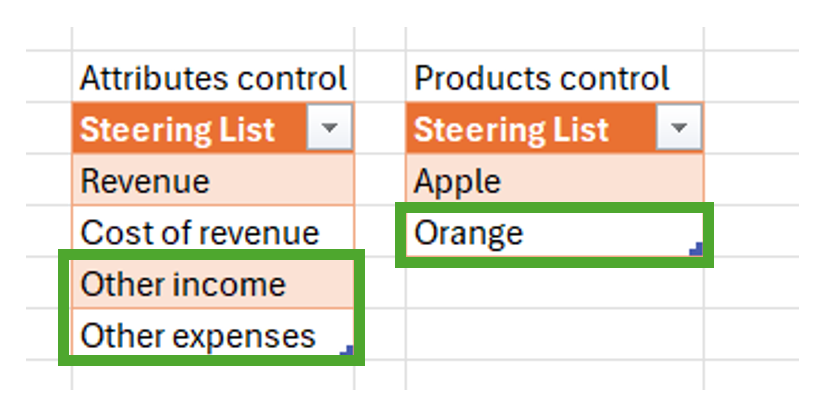
Let’s say the user wants to:
- Add a new product to the analysis
- Include Other Income & Expenses in addition to Revenue and Cost of Revenue
In the past, these changes would require manually extending formulas or restructuring the report layout. But now?
All the user has to do is to add the desired items to the steering lists, and the report updates automatically.
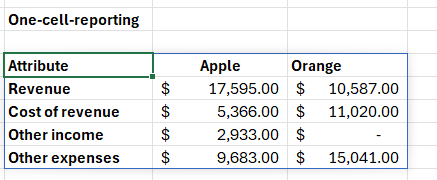
Just like that, the new attributes and products are reflected in the visual report — no broken formulas, no manual intervention.
The formula used:
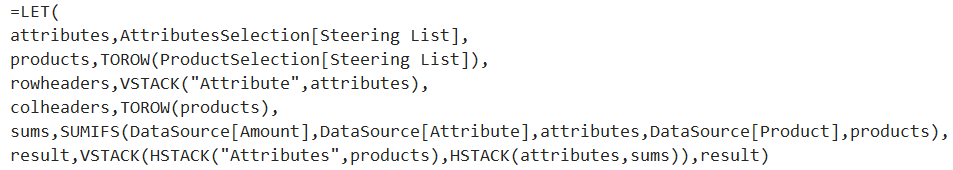
It might seem complicated at first sight, however, the idea is to collect within the LET function all the inputs needed to construct the future table.
Conclusion. Why This Matters
Using Excel 365 and Vena together, you no longer need to hardcode ranges or maintain fragile structures. You empower users to shape the report on their own terms — and give yourself peace of mind that everything will still work.
Our team often interviews users before starting template redesigns. If we see an opportunity to introduce one-cell logic, we know we can future-proof their reporting and reduce maintenance headaches down the road.
One-cell reporting isn’t just a technical trick. It’s a mindset shift — toward flexibility, simplicity, and scalability.